NORTV

logo of dechra pharmaceuticals

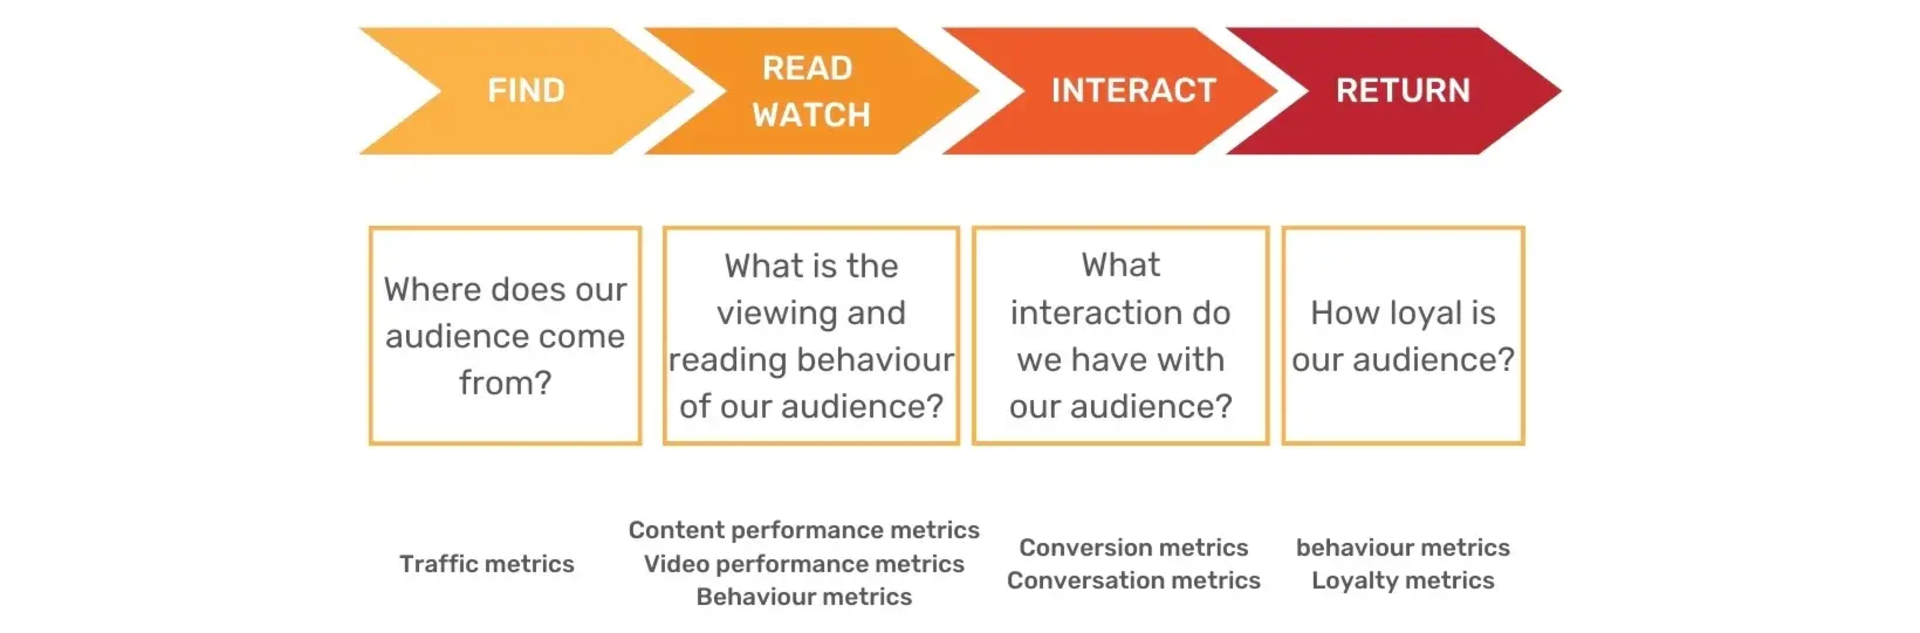
Integrated dashboards streamline online operations and content optimisation for local TV stations by providing insights into audience engagement. 

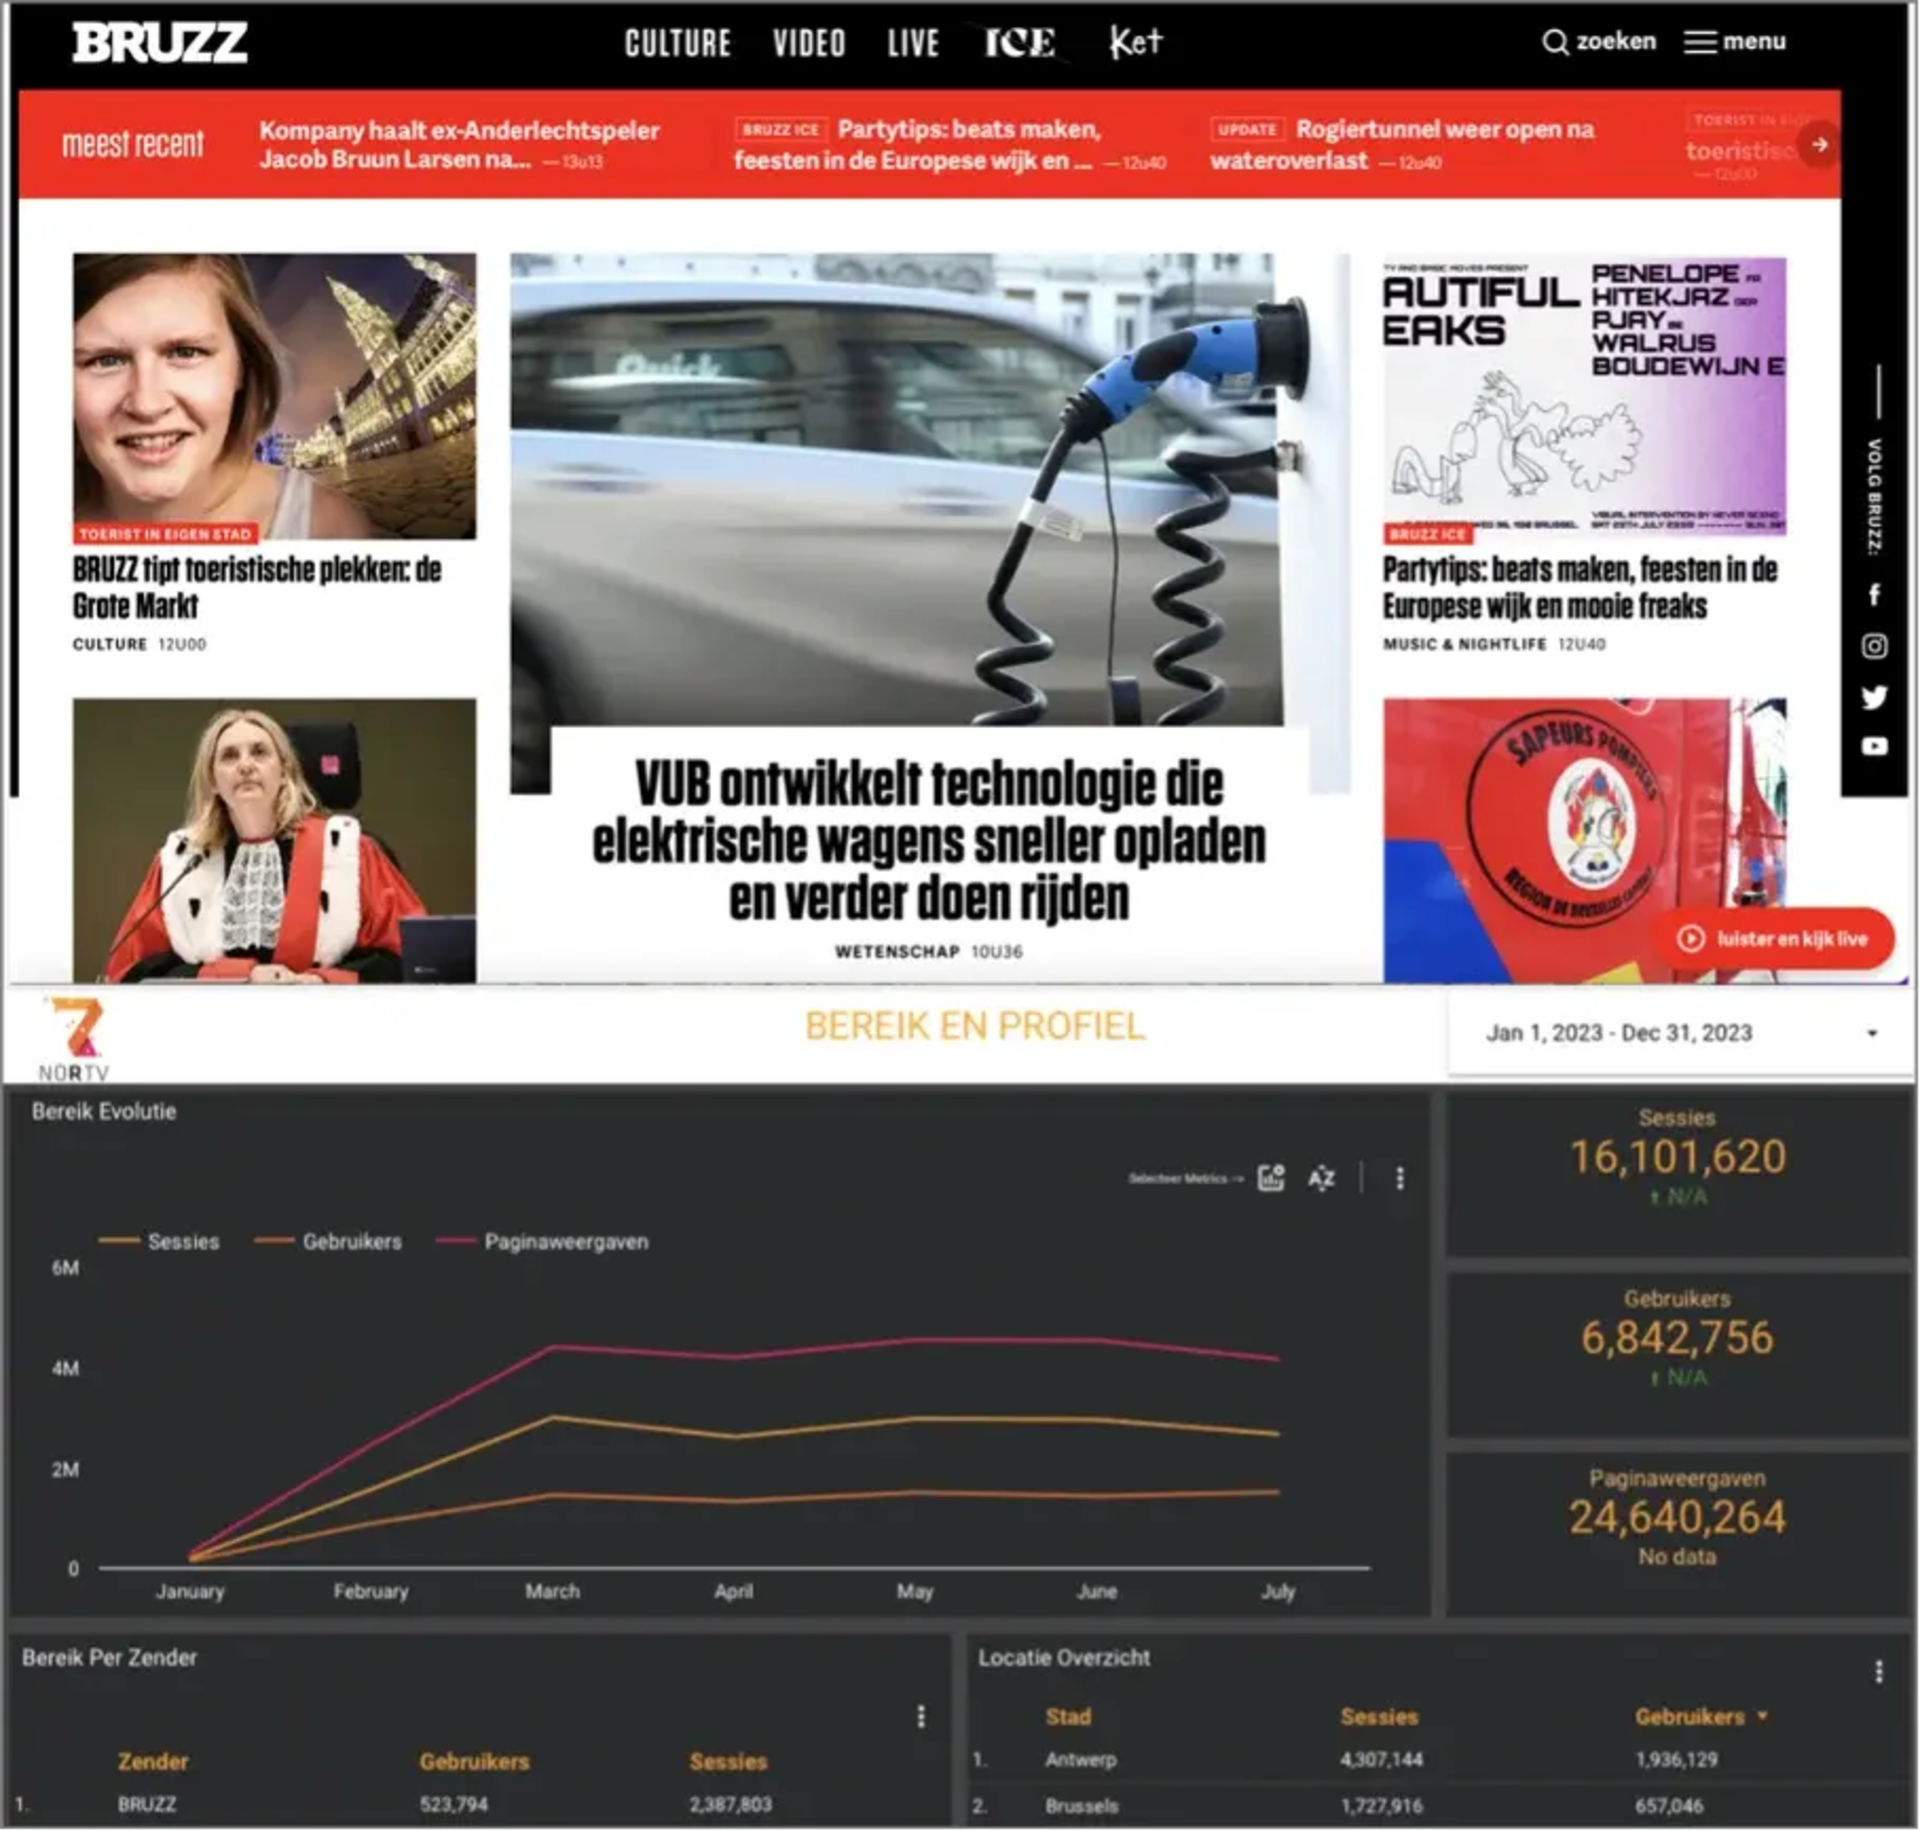
Discover how our integrated dashboards revolutionised online operations and content optimization for local TV stations, as exemplified by our successful collaboration with NORTV. Facing the challenge of enhancing digital reporting and analytics capabilities across Flemish local TV stations, NORTV sought a solution to effortlessly track and analyse real-time website and content performance without the burden of manual data extraction.

Man speaking in front of multiple screen displays showing broadcast interfaces and content.
medal like icon of database

1

central dashboard

Consolidates the performance of 8 local news websites

medal like icon of download

4 million

monthly pageviews

This volume of data offers the network a business opportunity to scale-up ad selling activities and increase revenue.

Challenge

All Flemish local TV stations wanted to improve digital reporting and analytics capabilities to better understand the audience and improve programming decisions. They were looking for a way to easily track and analyse website and content performance in dynamically, without having to manually pull data.

Discover how Dechra Pharmaceuticals, a global leader in veterinary pharmaceuticals, transformed its digital marketing through a data-driven strategy anchored by the North Star Metric. Learn how effective data governance and customer data architecture became the foundation for their success.

Solution

We implemented digital dashboards providing an integrated and centralised dynamically generated reporting system tracking and analysing audience reach and engagement. The dashboards provide insights into performance and visitor behaviour, allowing each TV station to optimise content, improve user experience, use data to sell ad space and benchmark performance with other stations.

To analyse the content performance in a consistent manner across all TV stations, a standard for content types and content categories was created and implemented in the backend of all websites. This allows us to track and analyse content uniformly and precise, to gather insights for the entire group of TV stations.

Website screenshot displaying news articles and analytics dashboard showing user engagement data.

The digital dashboards include features like:

  • Customisable widgets for tracking key-metrics such as website traffic, content engagement and ad performance

  • Dynamically generated reporting capabilities on different user levels. Allowing different roles to monitor the right performance metrics and take quick action

  • Customised data visualisation enabling the user to quickly identify trends and patterns in audience behaviour

  • Automated reporting, ensuring users to save time by eliminating the need for manual data analysis

Customer journey stages: Find, Read/Watch, Interact, Return, with corresponding audience questions and metrics.

Results

  • One central dashboard consolidates the performance of 8 local news websites.

  • With an average consolidated inventory of nearly 4.000 000 pageviews per month the consolidated data offers the network a business opportunity to scale-up ad selling activities and increase revenue.