News & Insights
Stay informed with our data news, insights, and opinions. Explore the latest trends in customer data through our expert perspective. And subscribe to our newsletter.

Discover a Data Engineering Intern's journey building an AI conversation agent. Learn key skills gained & challenges overcome. Read more!
Read more 
How to track and analyse AI Agents on your website.

Head of Omni-Channel Strategy Peter Vertongen
11 Aug 2025
Track AI Agents on your website! Learn how to navigate web analytics, GDPR, and ePrivacy compliance challenges. Get compliant tracking solutions.
Read more 
11 Years of MultiMinds: From Stack to System

1 Jul 2025
Discover MultiMinds' 11-year journey: from analytics to connected systems, mastering data & AI. Explore our ambitious roadmap & client trust.
Read more 
MultiMinds & Sirius Legal partner for a future-proof cookiescan solution. Ensure GDPR compliance for your data policies. Learn more now!
Read more 
MultiMinds Partners with Piwik PRO to Strengthen Commitment to Data Privacy and GDPR-Compliant MarTech Solution

Growth Expert Timon Braeckeveldt
1 Apr 2025
MultiMinds partners with Piwik PRO for GDPR-compliant MarTech solutions. Strengthen data privacy & drive smarter decisions. Learn more!
Read more 
AI Action Summit Paris: global talk with local impact
Head of Omni-Channel Strategy Peter Vertongen
18 Feb 2025
AI Action Summit Paris highlights ethical AI, sustainability, and EU AI Act impact on Belgian businesses. Ensure compliance—learn more!
Read more 
The Clear Benefits of Server-Side Tracking
3 Dec 2024
Discover the clear benefits of Server-Side tracking: minimize data loss, enhance control & performance. Own your data. Explore how SST transforms strategy.
Read more 
In this blog post, we focus on three prominent Server-Side Tracking solutions: Google Tag Manager, Segment and Tealium.
Read more 
New GDPR Guidelines on Legitimate Interest
Head of Omni-Channel Strategy Peter Vertongen
21 Nov 2024
In October 2024, The EU-Board adopted new Guidelines on processing personal data based on legitimate interest.
Read more 
Discover Server-Side tracking: gain control over your data, boost accuracy, and improve website speed. Explore three distinct strategies now.
Read more 
Don’t be fooled by Google’s U-turn: why you should stick to your first-party data strategy
8 Oct 2024
Google's U-turn on cookies doesn't change reality. Stick to your first-party data strategy for privacy, trust, and growth. Learn why.
Read more 
The White and Yellow Cross entrusts MultiMinds with its analytics challenges for the next 4 years
26 Sept 2024
MultiMinds partners with White and Yellow Cross for digital analytics. Discover their expertise in healthcare and advanced solutions. Learn more!
Read more 
Analyze hidden costs of incomplete data & its ripple effects. Learn why Server-Side tracking is essential for accurate insights. Discover more!
Read more 
Client-side tracking is failing. Learn why privacy concerns, ad blockers, & cookie depreciation impact your data. Regain control today!
Read more 
Uncover the truth about Customer Data Platforms (CDPs) and their real impact. Overcome implementation failures & drive ROI. Learn how to strategically use CDPs now!
Read more 
Discover my journey as a digital marketing intern at MultiMinds. Learn about SEO, social media, and professional growth. Explore the experience now!
Read more 
MultiMinds celebrates 10 years of success! Discover how our dedicated team, strong partnerships, & trust drive data excellence. Learn more about our journey.
Read more 
MultiMinds triumphs in KitchenAid EMEA pitch
11 Jun 2024
MultiMinds partners with KitchenAid EMEA for data, BI, & CX! Discover how our expertise secured this 3-year collaboration. Learn more.
Read more 
The Impact of Europe's AI Act on Customer Experience

Data Solutions Architect Jens Scheerlinck
18 Apr 2024
Understand the EU AI Act's impact on customer experience. Discover risk levels & compliance for your AI solutions. Learn more!
Read more 
CDP use cases: basics and beyond
21 Mar 2024
Discover essential CDP use cases: data unification, governance, personalization & more. Unlock better customer experiences and boost revenue. Learn how!
Read more 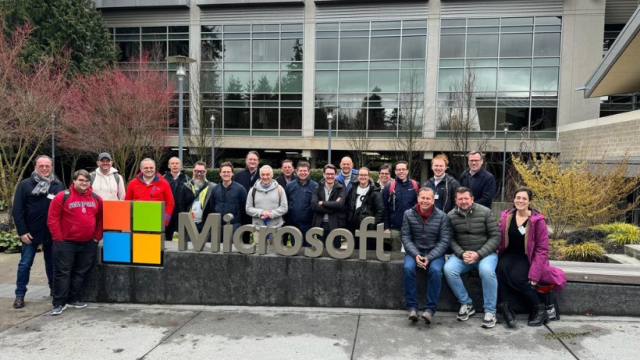
TechTrip Vancouver and Seattle

12 Mar 2024
Explore the Voka TechTrip to Vancouver & Seattle. Discover insights from MultiMinds, Microsoft, and more. Uncover tech transformations!
Read more 
CDP use case development and prioritisation
19 Feb 2024
Prioritise your CDP use cases effectively for success. Learn to define, evaluate, and implement impactful CDP strategies. Achieve your business goals today!
Read more 
How-to: Configure Consent Mode in Google Tag Manager

Managing Partner, Head of Operations Niels Verbeeck
8 Feb 2024
Configure Consent Mode in Google Tag Manager to comply with regulations. Learn setup, advanced vs. basic modes, and validation. Get started now!
Read more 
The crucial role of server-side tracking in complete data control
Head of Omni-Channel Strategy Peter Vertongen
6 Feb 2024
Reclaim control over your website data with server-side tracking. Ensure accuracy, enhance privacy, and gain vital insights. Learn more now!
Read more 
The (poisoned) gift of data governance

Data Analyst Jens Buelens
30 Jan 2024
Unlock effective Data Governance! Discover common pitfalls & strategies to avoid them, from tiered systems to change management. Optimize your data.
Read more 
Unwrapping a Customer Data Architecture
Data Solutions Architect Jens Scheerlinck
23 Jan 2024
Unlock competitive advantage with a robust customer data architecture. Design exceptional customer experiences from capture to activation. Learn more!
Read more 
Data as a key asset
Data Solutions Architect Jens Scheerlinck
16 Jan 2024
Discover how **data as a key asset** drives digital transformation. Learn to refine data, gain a competitive edge, & optimize strategies. Start now!
Read more 
Explore customer data platform (CDP) types: suite, smart hub, and composable. Discover which solution fits your needs best. Learn more now!
Read more 
Becoming a privacy-first company - 5: Wrap it up
21 Dec 2023
Master key takeaways for becoming a privacy-first company. Learn about compliance, strategic assets, consent, customer focus, & modern data stacks. Get started!
Read more 
CDP implementation
12 Dec 2023
Master CDP implementation: overcome challenges & unlock growth. Explore hurdles and a subscription-based solution. Learn more!
Read more 
Transform into a privacy-first company by mastering the modern data stack. Avoid data silos and gain ownership. Discover how here!
Read more 
Understand **customer data platforms**. Learn why CDPs are essential for personalized customer experiences and data-driven decisions. Explore CDP benefits now!
Read more 
Taking control: clickstream data offloading in a nutshell
Data Solutions Architect Jens Scheerlinck
24 Oct 2023
Unlock the power of your customer data. Learn how clickstream data offloading transforms analytics, boosts ownership, & creates value. Discover more now!
Read more 
Master privacy-first marketing with a trusted strategy. Learn to build trust and leverage first-party data effectively. Start strategizing now!
Read more 
Becoming a privacy-first company - 2: Where we're going
Head of Omni-Channel Strategy Peter Vertongen
19 Sept 2023
Become a privacy-first company! Learn why privacy-first marketing builds trust, ensures compliance, and protects data. Discover actionable strategies today.
Read more 
Discover why customer privacy matters & how scandals led to privacy laws like GDPR. Learn to thrive on the privacy-conscious internet. Read more to adapt.
Read more 
Four principles for a composable customer data strategy
Data Solutions Architect Jens Scheerlinck
11 Jul 2023
Unlock a composable customer data strategy with our 4 essential principles. Learn how to optimize your martech. Discover more now!
Read more 
Four signs your organisation is ready for composable technology
Data Solutions Architect Jens Scheerlinck
4 Jul 2023
Discover four key signs your organization is ready for **composable technology**. Evaluate your data strategy, complexity, culture, & scalability needs. Learn more!
Read more 
What is composable technology and why should you care?
Data Solutions Architect Jens Scheerlinck
29 Jun 2023
Composable technology is transforming MarTech. Discover its four pillars: ecosystem thinking, specialization, interoperability, and building blocks. Learn why it matters for your organization.
Read more 
Discover a Digital Marketeer's internship experience at MultiMinds. Learn about data-driven marketing, Web3, and GA4 projects. Explore their journey!
Read more 
Discover how self-sovereign identity (SSI) revolutionizes online advertising. Empower users, build trust, and drive engagement. Learn more now!
Read more 
The Future of Online Identity
25 May 2023
Explore the future of online identity and its impact on marketing. Discover new incentives, Web3.0, and Solid platform solutions. Contact us today!
Read more 
The Digital Markets Act (DMA) will revolutionize the online industry. Discover how it impacts platforms, users, and marketers today!
Read more 
Eureka! with Daniel Heer (Zeotap)
18 Apr 2023
Discover Zeotap CEO Daniel Heer's vision on Customer Data Platforms. Unify data, enhance privacy, & optimize business results. Read the interview!
Read more 
Welcome to our new data solutions architect
Last Wednesday
Meet our new Data Solutions Architect, Jens Scheerlinck. Discover how he'll deliver innovative, scalable data solutions for your business needs. Learn more!
Read more 
Automated migration by Google
Data Analyst Jens Buelens
14 Mar 2023
Avoid Google's automated GA4 migration. Manual migration ensures data quality, proper configuration & avoids event limits. Learn why & get expert GA4 help.
Read more 
Discover the top 5 trends in data and analytics for 2023: from crumbling cookies to SSI, ROI, and composable tech. Stay ahead. Explore now!
Read more 
Eureka! with Jascha Kaykas-Wolff (Lytics)
10 Jan 2023
Explore Jascha Kaykas-Wolff's journey through tech to Lytics. Discover agile marketing, ethical data use & CDPs' critical role. Learn more now!
Read more 
Beyond the Buzz: reverse ETL
13 Dec 2022
Unlock the power of reverse ETL! Explore its advantages over traditional CDPs for data activation and complex use cases. Discover key differences here.
Read more 
MeasureCamp Brussels brought together a growing analytics community to discuss GA4, privacy & more. Discover key insights & hot topics now!
Read more 
The online identity revolution of Web3
8 Nov 2022
Discover how Web3 revolutionizes online identity. Move beyond traditional logins with self-sovereign identity and digital wallets. Explore Web3's potential now!
Read more 
The end of third-party cookies is here. Should you consider server-side tracking as an alternative?
Head of Omni-Channel Strategy Peter Vertongen
6 Oct 2022
Third-party cookies are ending. Explore server-side tracking as a vital alternative for your business. Take our test to see if you're ready!
Read more 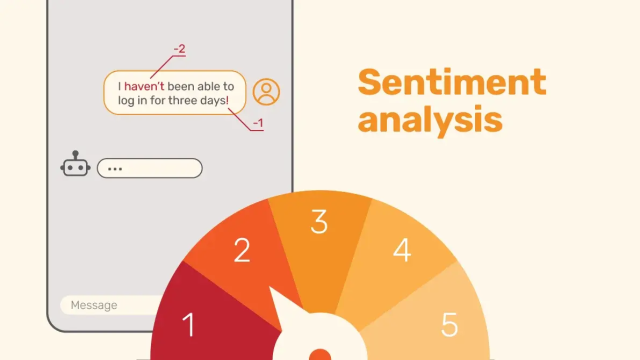
How are your customers really feeling? Sentiment analysis dissects the emotions behind written messages
27 Sept 2022
Uncover true customer emotions with sentiment analysis. Quantify feelings behind messages to prioritize support and spot trends. Learn how!
Read more 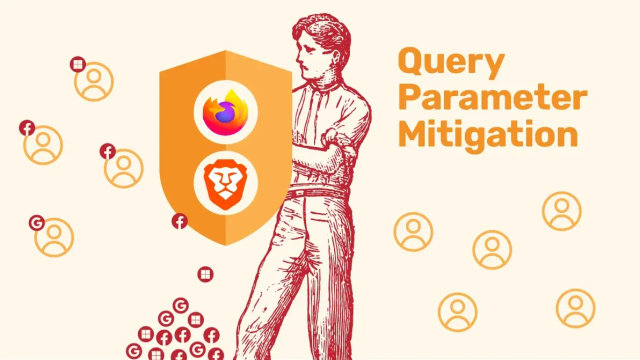
Mainstream browsers will soon block tracking IDs in URLs to boost your privacy. Learn how query parameter mitigation stops third-party tracking. Discover more!
Read more 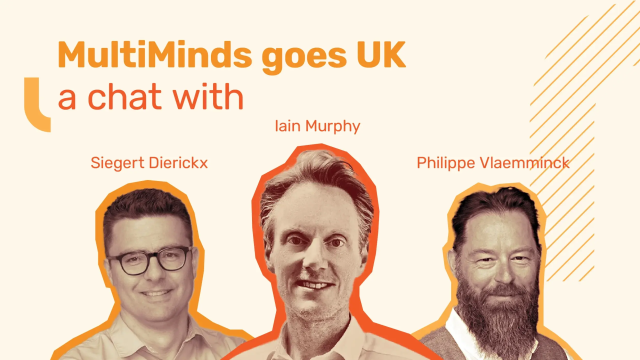
MultiMinds Goes UK - a chat with Iain Murphy
8 Sept 2022
MultiMinds expands to the UK with Iain Murphy as MD, establishing its first international office. Discover our global growth strategy. Learn more!
Read more 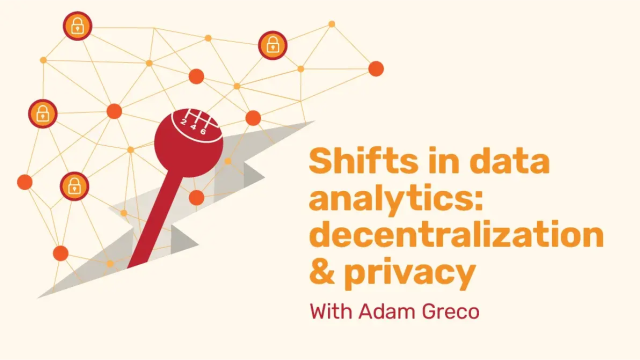
Decentralization and privacy: how digital analytics has changed, according to Adam Greco (Amplitude)
30 Aug 2022
Discover how digital analytics is transforming! Adam Greco discusses data decentralization and the critical rise of privacy. Explore the shifts today.
Read more 
Jim Stolze and Nicolas Lierman in conversation: Algorithm companies and digital monopolies
29 Jun 2022
Uncover the dangers of algorithm companies & digital monopolies with Jim Stolze & Nicolas Lierman. Explore their power & impact. Learn more now!
Read more 
Eureka! with Adam Greco (Amplitude)
13 Jun 2022
Discover digital analytics insights from Adam Greco (Amplitude). Learn how web and product analytics merge for optimal customer experience. Explore the future of data – read now!
Read more 
Discover expert insights on the future of data, privacy, and technology. Learn how to protect and personalize data for profit. Explore the equation now!
Read more 
Only 15% of requests for personal data are answered in compliance with GDPR
Head of Omni-Channel Strategy Peter Vertongen
24 May 2022
Only 15% of personal data requests comply with GDPR. Discover why Belgian companies fail & how automation is key. Improve your CX now!
Read more Discover the true worth of your personal data. Jim Stolze and Nicolas Lierman discuss its value, privacy, and future. Learn more now!
Read more 
Beyond the Buzz: self-sovereign identity
21 Apr 2022
Unlock the future of online identity with self-sovereign identity (SSI). Take control of your data & simplify digital interactions. Learn how SSI works now!
Read more 
Product analytics revolutionizes digital product evaluation. Understand customer behavior in-depth and improve retention. Discover the "why" your users act. Learn more!
Read more Jim Stolze & Nicolas Lierman discuss the ethical issues of biased algorithms. Discover how AI's "ethics washing" and lack of diversity create problems. Learn how to fix bias in algorithms.
Read more 
Beyond the Buzz: smart contracts
15 Mar 2022
Unlock the power of smart contracts! Explore how these blockchain-based agreements eliminate intermediaries, ensuring transparent and secure transactions. Discover their revolutionary impact.
Read more 
Discover insights from the Voka TechTrip US. Learn why American tech thrives, their views on EU privacy, and keys to innovation. Explore differences & opportunities.
Read more Discover how social media impacts society. Jim Stolze & Nicolas Lierman discuss regulation, algorithms, and accountability. Explore the future.
Read more 
Uncover MultiMinds' 7-year journey in data analytics. Siegert & Philippe discuss entrepreneurship, ethics & the future of data. Discover their insights now!
Read more Explore if "true AI" exists with Jim Stolze & Nicolas Lierman. They dissect AI's current state, its focus, & future potential. Discover their insights now.
Read more 
Beyond the Buzz: Web3
13 Jan 2022
Explore Web3's decentralization, dapps, and DeFi. Understand how this internet evolution impacts your business. Dive in now!
Read more Consent management: what good consent management looks like, and how to achieve it
Managing Partner, Head of Operations Niels Verbeeck
21 Dec 2021
Master consent management for GDPR compliance & user trust. Learn what makes a good cookie banner & implement best practices. Get started today!
Read more 
Discover Jim Stolze's insights on AI, digitalization, and tech's future. Learn how AI can make the world better. Explore now!
Read more 
X - Thou shalt be accountable for customer data
Head of Omni-Channel Strategy Peter Vertongen
7 Dec 2021
Accountability for customer data is vital. Learn why you are responsible for collected data & its 7 core principles. Protect your data now!
Read more 
Beyond the Buzz: the metaverse
30 Nov 2021
Explore the metaverse beyond the hype. Discover why Meta's vision may fail & the future of Web 3.0. Learn more about this evolving digital frontier today!
Read more Centralize marketing data with Marketing ETL. Learn this futureproof method to connect all your tools efficiently. Discover the advantages today!
Read more 
IX - Listen to thy customers
Head of Omni-Channel Strategy Peter Vertongen
9 Nov 2021
Leverage customer feedback to improve CX. Discover how to collect, organize, and use valuable insights to optimize your customer journey. Learn more!
Read more 
Google Tag Manager now hosts server-side tracking via Docker containers. Run GTM on your own server. Discover Google's new strategy.
Read more 
Discover how State Secretary Eva De Bleeker champions consumer protection in the digital age. Learn about her strategies for safety & rights. Explore now!
Read more 
VIII - Thou shalt keep humans in the loop
Head of Omni-Channel Strategy Peter Vertongen
19 Oct 2021
Supervise AI! Algorithms aren't perfect; ensure human oversight in data-driven CX automation. Learn why keeping humans in the loop is crucial.
Read more 
Beyond the Buzz: Google Analytics 4

Analytics Implementation Expert Sam Van Renterghem
12 Oct 2021
Demystify Google Analytics 4 (GA4). Uncover key changes, missing features, and whether to transition now. Get informed before you switch!
Read more 
Beyond the Buzz: data clean rooms
28 Sept 2021
Unlock the truth about data clean rooms. Discover if they protect privacy or are just hype. Get expert insights now!
Read more 
VII - Thou shalt never stop optimizing
Head of Omni-Channel Strategy Peter Vertongen
21 Sept 2021
Optimize customer experience continuously! Adapt to changing needs by enriching data & reiterating use cases. Discover how to improve your CX.
Read more 
DIAL: MultiMinds innovation lab
14 Sept 2021
Discover DIAL, MultiMinds' Data Innovation & Acceleration Lab. We drive innovation & digital acceleration for customers, exploring emerging tech like AI & Web3. Unlock your future today!
Read more Server-side tracking: what is it, and why should you consider implementing it?

Data Analyst Lead Lara Vandooren
31 Aug 2021
Discover server-side tracking: understand its benefits & why it's crucial for your data strategy. Learn how to implement this privacy-first solution today!
Read more 
VI - Deliver on thy brand promise
Head of Omni-Channel Strategy Peter Vertongen
17 Aug 2021
Deliver on your brand promise! Align customer experience with expectations to build loyal relationships. Learn how to meet client needs effectively.
Read more 
MultiMinds celebrates 7 years with a new innovation lab, DIAL, to accelerate customer data strategy and solve digital transformation challenges.
Read more 
V - Thou shalt be customer-centric front to end
Head of Omni-Channel Strategy Peter Vertongen
29 Jul 2021
Optimize CX with a customer-centric approach. Learn how to map processes & build a roadmap that puts customers first. Explore the service blueprint!
Read more 
Aurélie Pols, a data scientist & privacy engineer, discusses data abuse, GDPR, and the future of privacy. Learn her insights.
Read more 
Beyond the Buzz: audience modeling
7 Jul 2021
Lookalike audience modeling and evolutionary AI are revolutionizing old-school customer segmentation. Here’s what you should know.
Read more 
IV - Thou shalt identify thy audience
Head of Omni-Channel Strategy Peter Vertongen
17 Jun 2021
Identify your audience to offer exceptional digital customer experiences. Learn why personalized strategies drive success in the digital era.
Read more 
Eureka! with Jeroen Lemaire (In The Pocket)
8 Jun 2021
Have you checked the news lately? Made a shopping list? Spent money? If you did any of these using your smartphone, you’ve likely been touched by the wonderful world of In The Pocket.
Read more 
Know thy customer
27 May 2021
While technology keeps advancing, complexity increases as well – and so do concerns about online privacy.
Read more 
III - Thou shalt treasure thy data
Head of Omni-Channel Strategy Peter Vertongen
18 May 2021
Move over gold, myrrh and incense. The true treasure these days is data, so you should treat it as such.
Read more 
Beyond the Buzz: recommendation engines
11 May 2021
The internet has a response just for you. We’ve got recommendation engines to thank for that, for better or worse.
Read more 
Eureka! with José Fernandez (D'Ieteren)
22 Apr 2021
Discover José Fernandez's data breakthrough at D'Ieteren. Learn how he built predictive models for customer behavior. Read his story now!
Read more 
What if Jesus viewed his disciples as mere servants? He might have gone down in history as just another ungrateful boss, and the good word would probably have never spread.
Read more 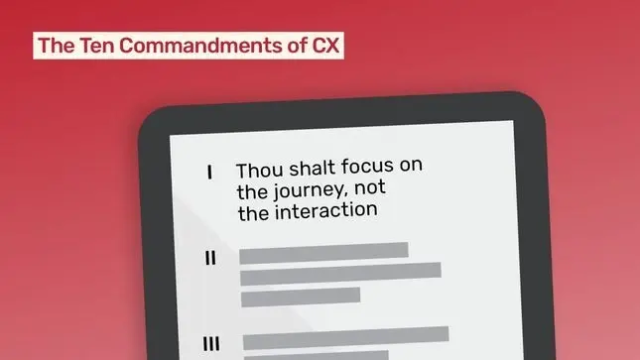
I - Thou shalt focus on the journey, not the interaction
Head of Omni-Channel Strategy Peter Vertongen
18 Mar 2021
Every customer interaction counts. But you should never lose sight of the overall journey. When Moses led the Hebrews into the Sinai, they wandered through the desert for three months.
Read more 
Eureka! with Mieke De Ketelaere
10 Mar 2021
“Suddenly, it became clear to me that customer data held a wealth of insights that could turn the marketing department from a cost into a profit center, simply through the application of data science.”
Read more 
Beyond the Buzz: predictive analytics
4 Mar 2021
If you could see the future, what would you do with that power? For modern businesses, that dream is slowly but surely becoming a reality, thanks to predictive analytics.
Read more 
Are marketers ruining the internet?
Head of Omni-Channel Strategy Peter Vertongen
16 Feb 2021
Marketers have the momentum to change the way we target customers and as a bonus we contribute in saving our democracy. How exciting is that?
Read more 
GA4: The new Google Analytics
Data Analyst Jens Buelens
20 Nov 2020
Google recently introduced Google Analytics 4 (or GA4 short) as its new default experience for all new properties.
Read more 
6 tips to successfully run experiments
Data Analyst Jens Buelens
29 Apr 2020
A short introduction to lookalike modelling
Data Analyst Jens Buelens
11 Mar 2020
The search for new potential customers can be long and exhausting. Where do you start looking and how do you reach new prospects?
Read more 
Israeli, wildly ambitious and very direct
21 Feb 2020
Last week I had the pleasure to join the Chamber of Commerce of East-Flanders (Belgium) on a tech-trip to Israel.
Read more 
DMP vs CDP
Data Analyst Jens Buelens
3 Feb 2020
Today’s customers interact with your brand across numerous different touch points and leave a significant trace of valuable data in these channels.
Read more 
What does a Digital Analytics Consultant do at MultiMinds?
Data Analyst Lead Lara Vandooren
31 Oct 2019
Lara is a Digital Analytics Consultant at MultiMinds. She found a job thanks to an enthusiastic acquaintance that believed in the future of digital analytics. We let her speak.
Read more 
4 common mistakes made in dashboard design
Data Analyst Jens Buelens
7 Oct 2019
Dashboards can be very useful to visualize your data in an effective and clear way. Although good dashboards should be straightforward and easy to interpret, the process of building them isn’t always a piece of cake.
Read more 
The what, why and how of A/B testing
Data Analyst Jens Buelens
6 Sept 2019

We believe in training, MultiMinds offers professional training in classroom style or coaching mode. Because we believe in sharing knowledge and know-how.
Read more 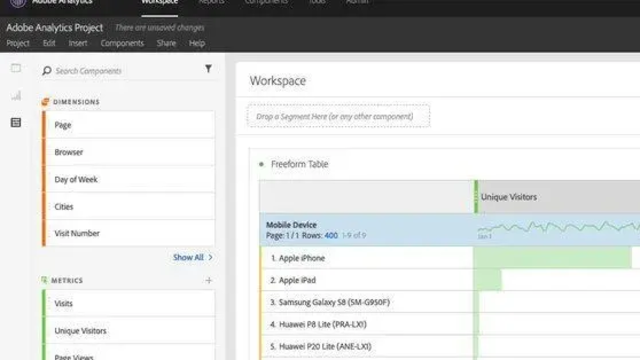
Adobe Analytics - Workspace Tips & Tricks
Data Analyst Lead Lara Vandooren
11 Mar 2019
Hi there, fellow Adobe user. As you may know, Adobe Analytics offers a wide range of possibilities; there are numerous options in the workspace alone.
Read more 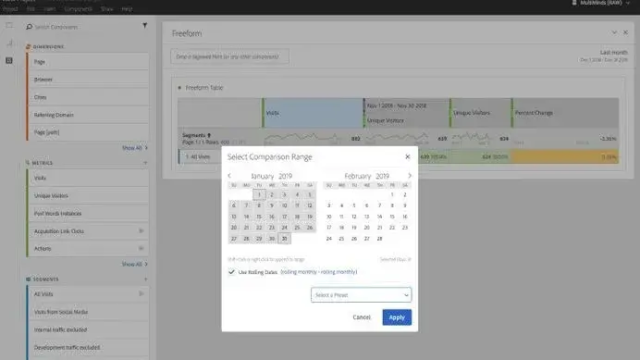
How to create a report with automatic rolling date ranges in Adobe Analytics
Data Analyst Lead Lara Vandooren
28 Jan 2019
How to create a report with automatic rolling date ranges in Adobe Analytics. Monthly dashboards were created in Adobe Analytics to compare some metrics to previous months.
Read more 
AI creates jobs, right? Right!?
12 Dec 2018
New technologies often confront people with a difficult factor of the unknown, with an inherent change around the corner.
Read more 
One of the coolest things with Google Analytics is all the different ways you can work with your data, and API's are a big part of that.
Read more 
Traditional Web Analytics is dying, what’s next?
23 Oct 2018
The ground is shaking and the landscape around you is changing rapidly. If you are a traditional web analyst you should be worried.
Read more 
My Internship at MultiMinds
16 Aug 2018
My first encounter with MultiMinds was at the VEK Career day in Ghent, which is an annual job fair organized by the VEK. As I am heading towards my last year of Business Engineering: Data Analytics, I wanted to do an internship to apply the theory into practice.
Read more 
My first year at MultiMinds

Technical Implementation Lead Geoffrey Pappaert
6 Jul 2018

Data Collection as the first step towards Data Activation
Managing Partner, Head of Operations Niels Verbeeck
2 Mar 2018
In comparison to many European countries, Belgium always has been a digital marketing laggard.
Read more 
Is your company ready for the GDPR?
6 Mar 2017
Take your agenda and on May 25, 2018, write down: “Take the day off”. It will be the most rewarding day because all your friends in the data industry will be hard at work. The reason? It’s the day GDPR will become law, and you will be totally relaxed because you are ready for it. Right? Right! Well just keep on reading if this all sounds a bit hazy to you.
Read more 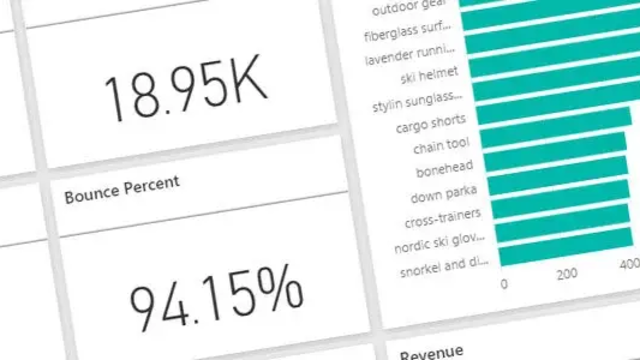
Participation Metrics in Adobe Analytic
Data Analyst Lead Lara Vandooren
12 Jan 2017
Adobe Analytics offers many interesting features, and in my opinion, the participation metric is definitely one of them. In this post I will talk about the benefits, why you should use them, and also teach you to enable them in your analysis workspace.
Read more 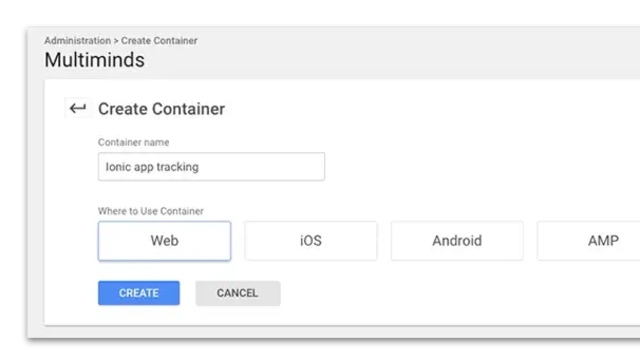
Recently we did a tracking implementation for a client with an online service that had both a standard website and a mobile iOS app.
Read more 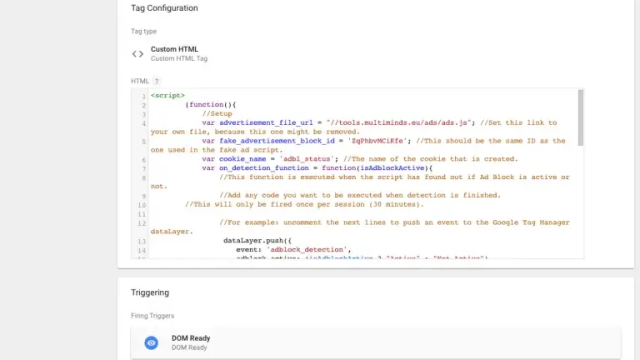
How to measure Ad Blocker with Google Tag Manager
Analytics Implementation Expert Sam Van Renterghem
30 Sept 2016
Have you ever wondered how many people on your site have an Ad Blocker active? Would you like to know what effect this has on your visitors?
Read more 
Learn how to get started with the Google Analytics Reporting API v4 using Python. This tutorial covers setup, authorization, querying the API, and visualizing GA data.
Read more 
Celebrating One Year of MultiMinds
1 Jul 2015
MultiMinds celebrates its 1st anniversary. Learn how our data analytics team grew from 2 to 6 minds in one year, partnered with leading brands like Colruyt Group, and what's next.
Read more 
MultiMinds for Voka’s Flanders Future Bryo
8 Jan 2015
MultiMinds reflects on a successful 2014 launch. See how we started our adventure, established our Aalst base, and set our ambitions for the future.
Read more